
How to customise GA4 reports: Complete guide for small businesses
Oct 15, 2025By Lorna Walker
Why customise GA4 reports for your business?
Google Analytics 4's standard reports provide a wealth of information, but they're designed to serve everyone – which means they might not show exactly what matters most to your business. However, by customising your GA4 reports, you can transform generic data into actionable insights that directly support your business goals.
Think of it this way: if you run a local bakery, you probably care more about which products sell best on weekends than about technical mobile app metrics. Custom reports let you spotlight the data that helps you make better business decisions whilst hiding information that isn't relevant to your situation.
Key benefits of GA4 report customisation
- Save time: See only the metrics that matter to your business goals
- Better decision making: Focus on data that drives actionable insights
- Team accessibility: Create reports that non-technical team members can understand
- Performance tracking: Monitor specific KPIs that align with your marketing objectives
Getting started with GA4 report customisation
Before diving into customisation, you'll need editor or administrator access to your GA4 property. If you're working with a marketing agency or web developer, make sure you have the right permissions to modify reports. Bear in mind that any changes you make to the standard reports, or any new reports you add. will be visible to everyone who has access to that GA4 account so it's generally better to set up new reports that do exactly what you want than to edit existing reports, in case someone else is using that existing report.
Finding the customisation options
In GA4, you can customise two main types of reports:
- Detail reports: In-depth data tables with charts (found in sections like Acquisition, Engagement, Monetisation)
- Overview reports: Summary dashboards that show snapshot information
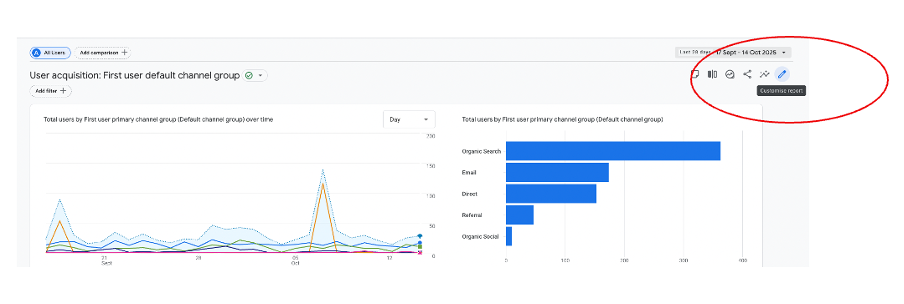
To start customising a detail report, navigate to any report (such as Reports > Acquisition > Traffic acquisition) and look for the "Customise report" button in the top-right corner. This opens the customisation panel where you can modify what data appears in your report.
Customising dimensions and metrics
Dimensions and metrics are the building blocks of your GA4 reports. Understanding how to modify these is essential for creating reports that serve your business needs.
Understanding dimensions vs metrics
Think of dimensions as the "what" and metrics as the "how much":
- Dimensions: Categories that describe your data (like "Page title", "Country", or "Device category")
- Metrics: Numbers that measure things (like "Users", "Sessions", or "Conversion rate")
Modifying dimensions in your reports
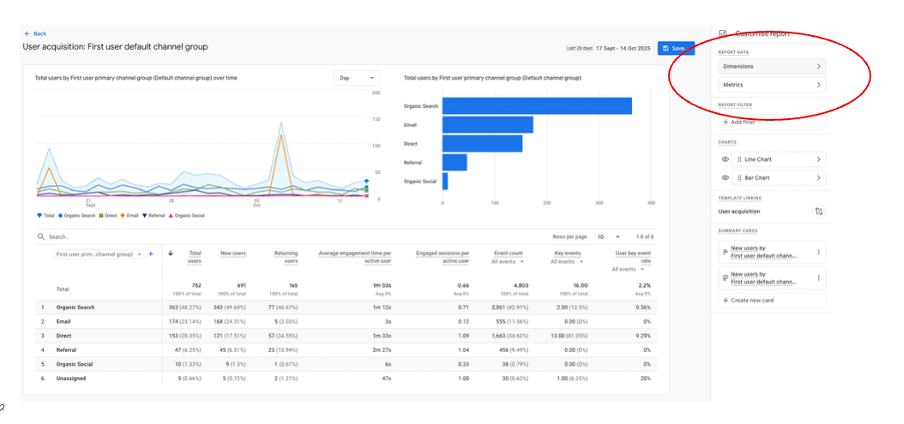
In the customisation panel, you'll find the "Primary dimensions" section where you can:
- Change the primary dimension: Click the dropdown to select a different way to group your data
- Add secondary dimensions: Include additional categories to break down your data further
- Reorder dimensions: Drag dimensions up or down to change their priority
- Remove dimensions: Click the X next to any dimension you don't need
Working with metrics
The metrics section allows you to control which numbers appear in your report columns:
- Add relevant metrics: Click "Add metric" to include measurements that matter to your business
- Remove unnecessary metrics: Streamline your report by removing metrics you don't use
- Reorder columns: Drag metrics to arrange them in order of importance
- Set default sorting: Choose which metric the report should sort by automatically
Adding filters to focus your data
Filters are like digital sieves that let you focus on specific subsets of your data. They're particularly useful for small businesses that want to exclude internal traffic, focus on specific geographic areas, or analyse particular customer segments.
Types of filters you can apply
GA4 offers several matching options for filters:
- Exact match: Shows data that exactly matches your criteria
- Contains: Includes data that contains your specified text
- Does not contain: Excludes data containing your specified text
- Begins with: Shows data that starts with your specified text
- Regular expressions: Advanced pattern matching for complex filtering
Step-by-step guide to adding filters
- In the customisation panel, scroll to the "Report filter" section
- Click "Add filter" to create a new filter condition
- Choose a dimension from the dropdown (only dimensions with values appear)
- Select your match type based on what you want to include or exclude
- Enter your filter criteria in the text box
- Optionally, add up to four additional conditions using "Add new condition"
- Click "Apply" to activate your filter

Practical filter examples for small businesses
Here are some real-world filtering scenarios:
Excluding internal traffic
Filter dimension: "IP address" | Match type: "Does not contain" | Value: Your office IP address
Focusing on local customers
Filter dimension: "Country" | Match type: "Exact match" | Value: "United Kingdom"
Analysing mobile users only
Filter dimension: "Device category" | Match type: "Exact match" | Value: "mobile"
Excluding test pages
Filter dimension: "Page path and screen class" | Match type: "Does not contain" | Value: "/test"
Combining multiple filter conditions
You can create sophisticated filters by combining multiple conditions. All conditions are connected with "AND" logic, meaning all conditions must be true for data to appear in your report. For example, you could show only mobile users from the UK who visited your contact page.
Customising charts and visualisations
Visual representations of your data can make trends and patterns much easier to spot. GA4 allows you to customise which charts appear in your reports and how they display your information.
Available chart types in GA4
Different chart types work better for different kinds of data analysis:
- Line charts: Perfect for showing trends over time
- Bar charts: Great for comparing different categories
- Pie charts: Useful for showing proportions of a whole
- Geo maps: Ideal for displaying geographic data
- Tables: Best for detailed numerical analysis
Customising chart display
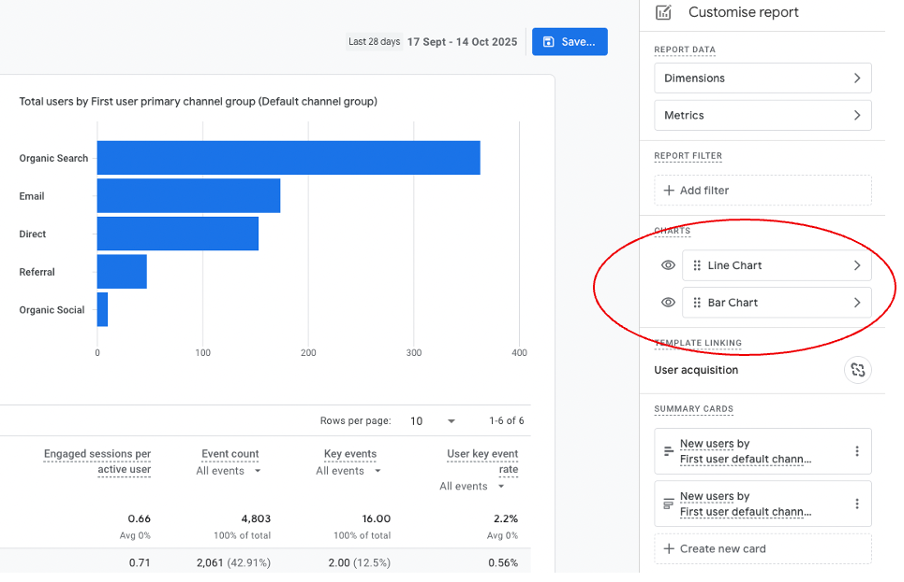
In the customisation panel under the "Charts" section, you can:
- Show or hide charts: Toggle charts on or off using the eye icon
- Change chart types: Click the chart type selector to switch visualisations
- Modify chart data: Charts automatically update when you change dimensions or apply filters
Choosing the right chart for your data
Consider your analysis goals when selecting chart types:
- Tracking website performance over time: Use line charts to show metrics like users or sessions across days or weeks
- Comparing traffic sources: Bar charts effectively compare different channels like organic search, social media, and direct traffic
- Understanding geographic distribution: Geo maps help visualise where your visitors are located
- Analysing device usage: Pie charts can show the proportion of desktop vs mobile vs tablet users
Creating summary cards for quick insights
Summary cards are like dashboard widgets that highlight key metrics from your detailed reports. They appear in overview reports and provide at-a-glance information about your most important business metrics.
What makes a good summary card
Effective summary cards should:
- Focus on one key metric that matters to your business goals
- Use clear, descriptive titles that non-technical team members can understand
- Choose appropriate visualisations that make the data easy to interpret
- Display data that you check regularly to monitor business performance
Creating custom summary cards
- While customising a detail report, scroll to the "Summary cards" section
- Click "Create new card" to start building your summary
- Choose dimensions that categorise your data appropriately
- Select metrics that represent the key numbers you want to track
- Pick a visualisation type that best represents your data
- Give your card a clear, descriptive name
- Click "Apply" to create your card

Useful summary card ideas for small businesses
- Monthly revenue trend: Line chart showing purchase revenue over the last 12 months
- Top traffic sources: Bar chart displaying your main acquisition channels
- Popular products/services: Table showing your best-performing pages or items
- Geographic reach: Geo map highlighting where your customers are located
- Mobile vs desktop usage: Pie chart showing device category breakdown
Adding summary cards to overview reports
Once you've created summary cards in detail reports, you can add them to overview reports for easy access. In any overview report, click the "Customise report" button and look for the "Cards" section to add your custom cards alongside the default ones.
Saving and organising your custom reports
After investing time in customising your reports, you'll want to save your work and organise it effectively. GA4 provides several options for preserving and sharing your custom configurations.
Saving options
When you've finished customising a report, you have two saving choices:
- Save changes to current report: Overwrites the existing report with your modifications
- Save as new report: Creates a separate custom report, leaving the original unchanged
For most small businesses, creating new reports is the better option because it preserves the standard reports whilst giving you customised versions for specific needs.
Organising reports in collections
GA4 uses "collections" to group related reports together. You can add your custom reports to existing collections or create new ones:
- Go to Reports > Library in the left navigation
- Click "Edit collection" for an existing group, or "Create new collection"
- Drag your custom reports into the appropriate sections
- Give your reports descriptive names that your team will understand
- Click "Save changes to current collection" to apply your organisation
Report naming best practices
Choose names that clearly indicate what each report shows:
- Avoid generic names: Instead of "Custom Report 1", use "Mobile Traffic Sources"
- Include key filters: "UK Users Only" or "Exclude Internal Traffic"
- Mention the purpose: "Weekly Performance Review" or "Product Page Analysis"
- Use consistent naming: Establish a naming convention for your team
Common mistakes to avoid
Learning from others' experiences can save you time and frustration. Here are the most common pitfalls when customising GA4 reports and how to avoid them.
Over-complicating your reports
It's tempting to include every possible metric and dimension, but cluttered reports are difficult to interpret and act upon. Instead:
- Start with 3-5 key metrics that directly relate to your business goals
- Add complexity gradually as you become more comfortable with the data
- Regularly review and remove metrics that aren't providing actionable insights
- Create multiple focused reports rather than one comprehensive dashboard
Forgetting about data sampling
GA4 may sample your data when processing large datasets, which can affect the accuracy of your custom reports. Be aware that highly filtered reports with complex conditions are more likely to trigger sampling.
Not considering user permissions
Remember that other users may not have the same level of analytics knowledge as you. When creating reports that others will use:
- Include clear, descriptive names for all custom elements
- Add brief explanations of what key metrics mean
- Avoid overly technical terminology
- Test your reports with intended users before finalising them
Failing to document your customisations
Keep track of what filters and modifications you've applied to each custom report. This documentation helps you:
- Remember why you created specific reports
- Explain your setup to team members or agencies
- Troubleshoot discrepancies between reports
- Recreate successful configurations for other properties
Getting additional support
If you need help implementing these customisations or want to explore more advanced analytics strategies, consider:
- Google's official GA4 help documentation and video tutorials
- Book some one to one Google Analytics training with us
Remember, the goal isn't to become a data scientist overnight – it's to gradually build your confidence with GA4 so you can make informed decisions that help your business grow. Start with simple customisations and gradually work towards more sophisticated analysis as your comfort level increases.
Struggling to implement these strategies in your own business? You're not alone. Join our training webinars designed specifically for small and medium businesses ready to take their digital marketing to the next level. View our complete list of upcoming topics and training sessions.
